Methods
The High Resolution Electricity Access (HREA) project leverages high resolution satellite data to generate estimates of electrification access at a higher spatial resolution than ever before. The estimates are derived from the first long-scale analysis of the complete archive of nighttime light imagery from the VIIRS sensor, from 2012–present, tracked against new population estimates based on computer vision techniques identifying all human-built settlement structures.
As the result of a collaboration between the University of Michigan, World Bank, and National Oceanic Atmospheric Administration, we have produced the Light Every Night dataset, a complete archive of all nighttime imagery captured by VIIRS-DNB across the globe, from 2012 to the present, and DMSP-OLS from 1992-2013. This massive archive, comprising over 360TB of data across millions of files, describe visible band brightness, cloud cover, and associated metadata from suborbits captured across the globe every night.
HREA utilizes the complete record of VIIRS-DNB data. Launched aboard the Suomi National Polar-orbiting Partnership (SNPP) satellite in 2011, the Visible Infrared Imaging Radiometer Suite (VIIRS) provides dramatically increased precision and accuracy of nighttime light measurement compared to DMSP-OLS. The VIIRS nighttime sensor (or Day-Night Band) captures data at a much higher spatial resolution (~750m), with a higher dynamic range that is much better calibrated and able to accurately record luminosity at extremely dim levels.
In order to use light output as a useful indicator of electricity use, we need data on the location of human settlements. However, in most countries, there are significant limitations on the availability, accuracy, and reliability of population data. We rely on recently computer-generated data on built-up areas. These efforts rely on machine learning and computer vision techniques to identify the location of buildings within a country. The building outlines are then georeferenced and linked with census tract population estimates.
We link VIIRS data to high resolution settlement maps along a constant spatial grid. This provides a spatially constant reference on which to map the both nighttime lights data and settlements. Then, for each night, we compare the light output of each settlement against a model-based prediction of background brightness measured from comparable isolated, uninhabited pixels. We then estimate the statistical confidence that the settlement is brighter than the background, and repeat the process for every settlement within a country. We then aggregate the nightly estimates across the calendar year to generate annual measures for each settlement of likelihood of electricity access, proportion of nights that are lit, and statistically recalibrated light output intensity.
Computational Image Processing
Every night, the VIIRS-DNB sensor collects data on the observed brightness over all locations within a country, including over electrified and unelectrified areas, and populated and unpopulated areas. Our objective is to measure the level of electricity access of populated areas. The challenge is that even perfectly-calibrated light output can be due to multiple sources unrelated to electricity use. Notably, the Day Night Band is so sensitive that it picks up light from overglow, atmospheric interactions, moonlight, and surface reflectivity of the land cover. We refer collectively to these exogenous sources as background noise, which must be accounted for to classify whether an area is brighter than expected on any given night.
Radiance levels are recorded on all nights since early 2012. Values are subsequently dropped if they are considered low-quality by algorithms developed by NOAA: a) they are obstructed by clouds; b) they are sunlit, outside the nighttime cutoff zone (i.e., below the solar zenith angle 101°); c) they are moonlit, with lunar illumination above .0005 lux (or .005 lux for regression based estimates); d) high energy particles were detected; e) they are obstructed by stray light (solar zenith angle at nadir between 90–118.5°); f) surface lightning was detected; or g) gas flares were detected (temperature > 1200 K and frequency > 1%).
Because the radiance values are heavily right-skewed (i.e., there are some extremely large positive values, relative to the average), and some are slightly negative (the technical minimum is -1.5), we add 2.5 to the remaining values and apply the natural logarithm when generating averages. To generate annual estimates, the average of all good quality nightly values for each pixel in each calendar year is calculated.
We use data on light output detected over areas with no artificial structures to train a statistical model of background noise. The model can be used to generate an expected brightness value on every given night for every given location. We then compare a settlement's observed brightness on each night against the expected baseline brightness value for a comparable location. Areas with human settlements with brighter light output than expected are assumed to have access to electricity on that night. We classify all settlements on all nights and then aggregate the estimates to generate a “likelihood electrified” estimate for each calendar year for all settlement areas. Areas that are much brighter than would be expected on most nights have the highest probability of being electrified. Areas that are as dim as areas with no settlements have the lowest probability of being electrified. Areas that are a little brighter on some nights have middling probabilities of electricity access.
The advantage of this process is that it fully incorporates all available nightly data from the VIIRS data stream while taking into account known and unknown sources of data noise and variability. The process also generates probability estimates that allow for the identification of areas where the likelihood of electricity access and use is most uncertain. This is significant given that traditional binary measures of access do not account for variations in levels of use or reliability of power supply, even across areas that are all nominally electrified.
HREA Process Steps
1) Select random sample of locations with no settlements to measure background noise
We select a stratified random sample of isolated non-settlement 15 arcsecond pixels to use in the regression. We define a 15 arcsecond non-settlement pixel as one which contains no 1 arcsecond settlement pixels. We define an isolated non-settlement pixel as one for which none of its 8 neighboring 15 arcsecond cells contains settlement pixels either. Thus, these pixels should be relatively far from artificial sources of light. We select a random sample of such pixels stratified by land cover type.
2) Select observations
Following NOAA guidelines and their data quality flags, we drop bad quality data, including those with heavy cloud cover and excessive sensor noise. NOAA also drops many nights with high lunar illumination. We relax this threshold slightly (from .0005 to .005 lux), thus keeping additional observations with modest lunar illumination to preserve more data. Furthermore, we only include observations between 11pm and 4am local mean time.
3) Remove outliers
To generate a reliable estimate of background noise, we need to exclude outliers. Presumably, an unusually high brightness value in an unsettled area is not due to background noise but rather due to external, non-systematic phenomena. First, by country and year, we calculate the mean and standard deviation of radiance for each isolated 15 arcsecond non-settlement pixel. Then, by land cover type, we exclude points which have means or standard deviations below the 1st or above the value equal to the median plus the difference between the 1st and 50th percentile (this is more robust than using the 99th percentile). After selecting the random sample of points to keep, we proceed to remove individual outlier observations. First, we drop observations that have brightness values four standard deviations above the median logged radiance value. Next, by date and land cover type, we drop observations that are four standard deviations above the mean radiance value for that night and land cover pair.
4) Create statistical model of background noise
For each calendar year, we run a linear mixed effects model on light output for randomly selected pixels in areas with no settlements. The aim is to understand the exogenous factors that explain variation in light levels for areas where there are no human settlements, and presumably no electricity. The model includes observations from a selection of isolated non-settlement pixels from all good quality nights, and includes fixed controls for month, land type, lunar illumination, local mean time, and the interaction between land cover type and lunar illumination, as well as a date random effect. Notably, the regression diagnostics are excellent with strong linearity, few outliers, and limited heteroskedasticity. In mathematical notation, level 1 of the linear mixed regression model takes the following theoretical form:
$\begin{eqnarray} \mathrm{visible radiance}_{i, j} = & \beta_{0, j} + \beta_{1, j} \mathrm{lunar illumination}_{i, j} + \beta_{2, j} \mathrm{time}_{i, j} + \mathbf{\beta}_{\mathbf{3, j}} \textbf{month}_{\mathbf{i, j}} + \\ & \mathbf{\beta}_{\mathbf{4, j}} \textbf{land cover}_{\mathbf{i, j}} + \mathbf{\beta}_{\mathbf{5, j}} \left( \textbf{land cover} \times \mathrm{lunar illumination} \right)_{\mathbf{i, j}} + e_{i, j} \end{eqnarray}$
Using these statistical parameters learned from data on non-settlement areas, we then calculate the expected level of light output for all areas with settlements. These predicted values represent a counterfactual estimate of how much light would be expected on that specific day on that type of land, if the only sources of light were from background noise and other exogenous factors. Areas with higher observed light output than expected light output will be assumed to have electricity access.
5) Identify electrified settlement areas on each night
We compare the actual observed level of light output against the expected light output level from the model above for every settlement pixel on every night. This difference in the observed versus expected light output is our measure of anthropogenic light generation on each night. We standardize these values by dividing by the standard deviation of model residuals to generate z-scores for each pixel on each night. Higher z-scores imply higher light output than expected due to exogenous factors alone (i.e. non-human factors like land type, lunar illumination, etc.). The key assumption is that higher scores indicate higher likelihood that a settlement is using electricity on that specific night.
6) Aggregate nightly estimates to generate “Likelihood Electrified” and “Proportion of Nights Lit” values for all settlement areas for each year
We use the mean of all nightly z-scores for each settlement to generate annual electrification probabilities for all 15 arcsecond pixels with settlements across the country. We repeat the process for all years of VIIRS data. An alternative product instead calculates the proportion of nights for which the standardized residuals are above a given threshold for a particular pixel, thus generating an estimate of the proportion of nights for which the settlement had visible artificial light.
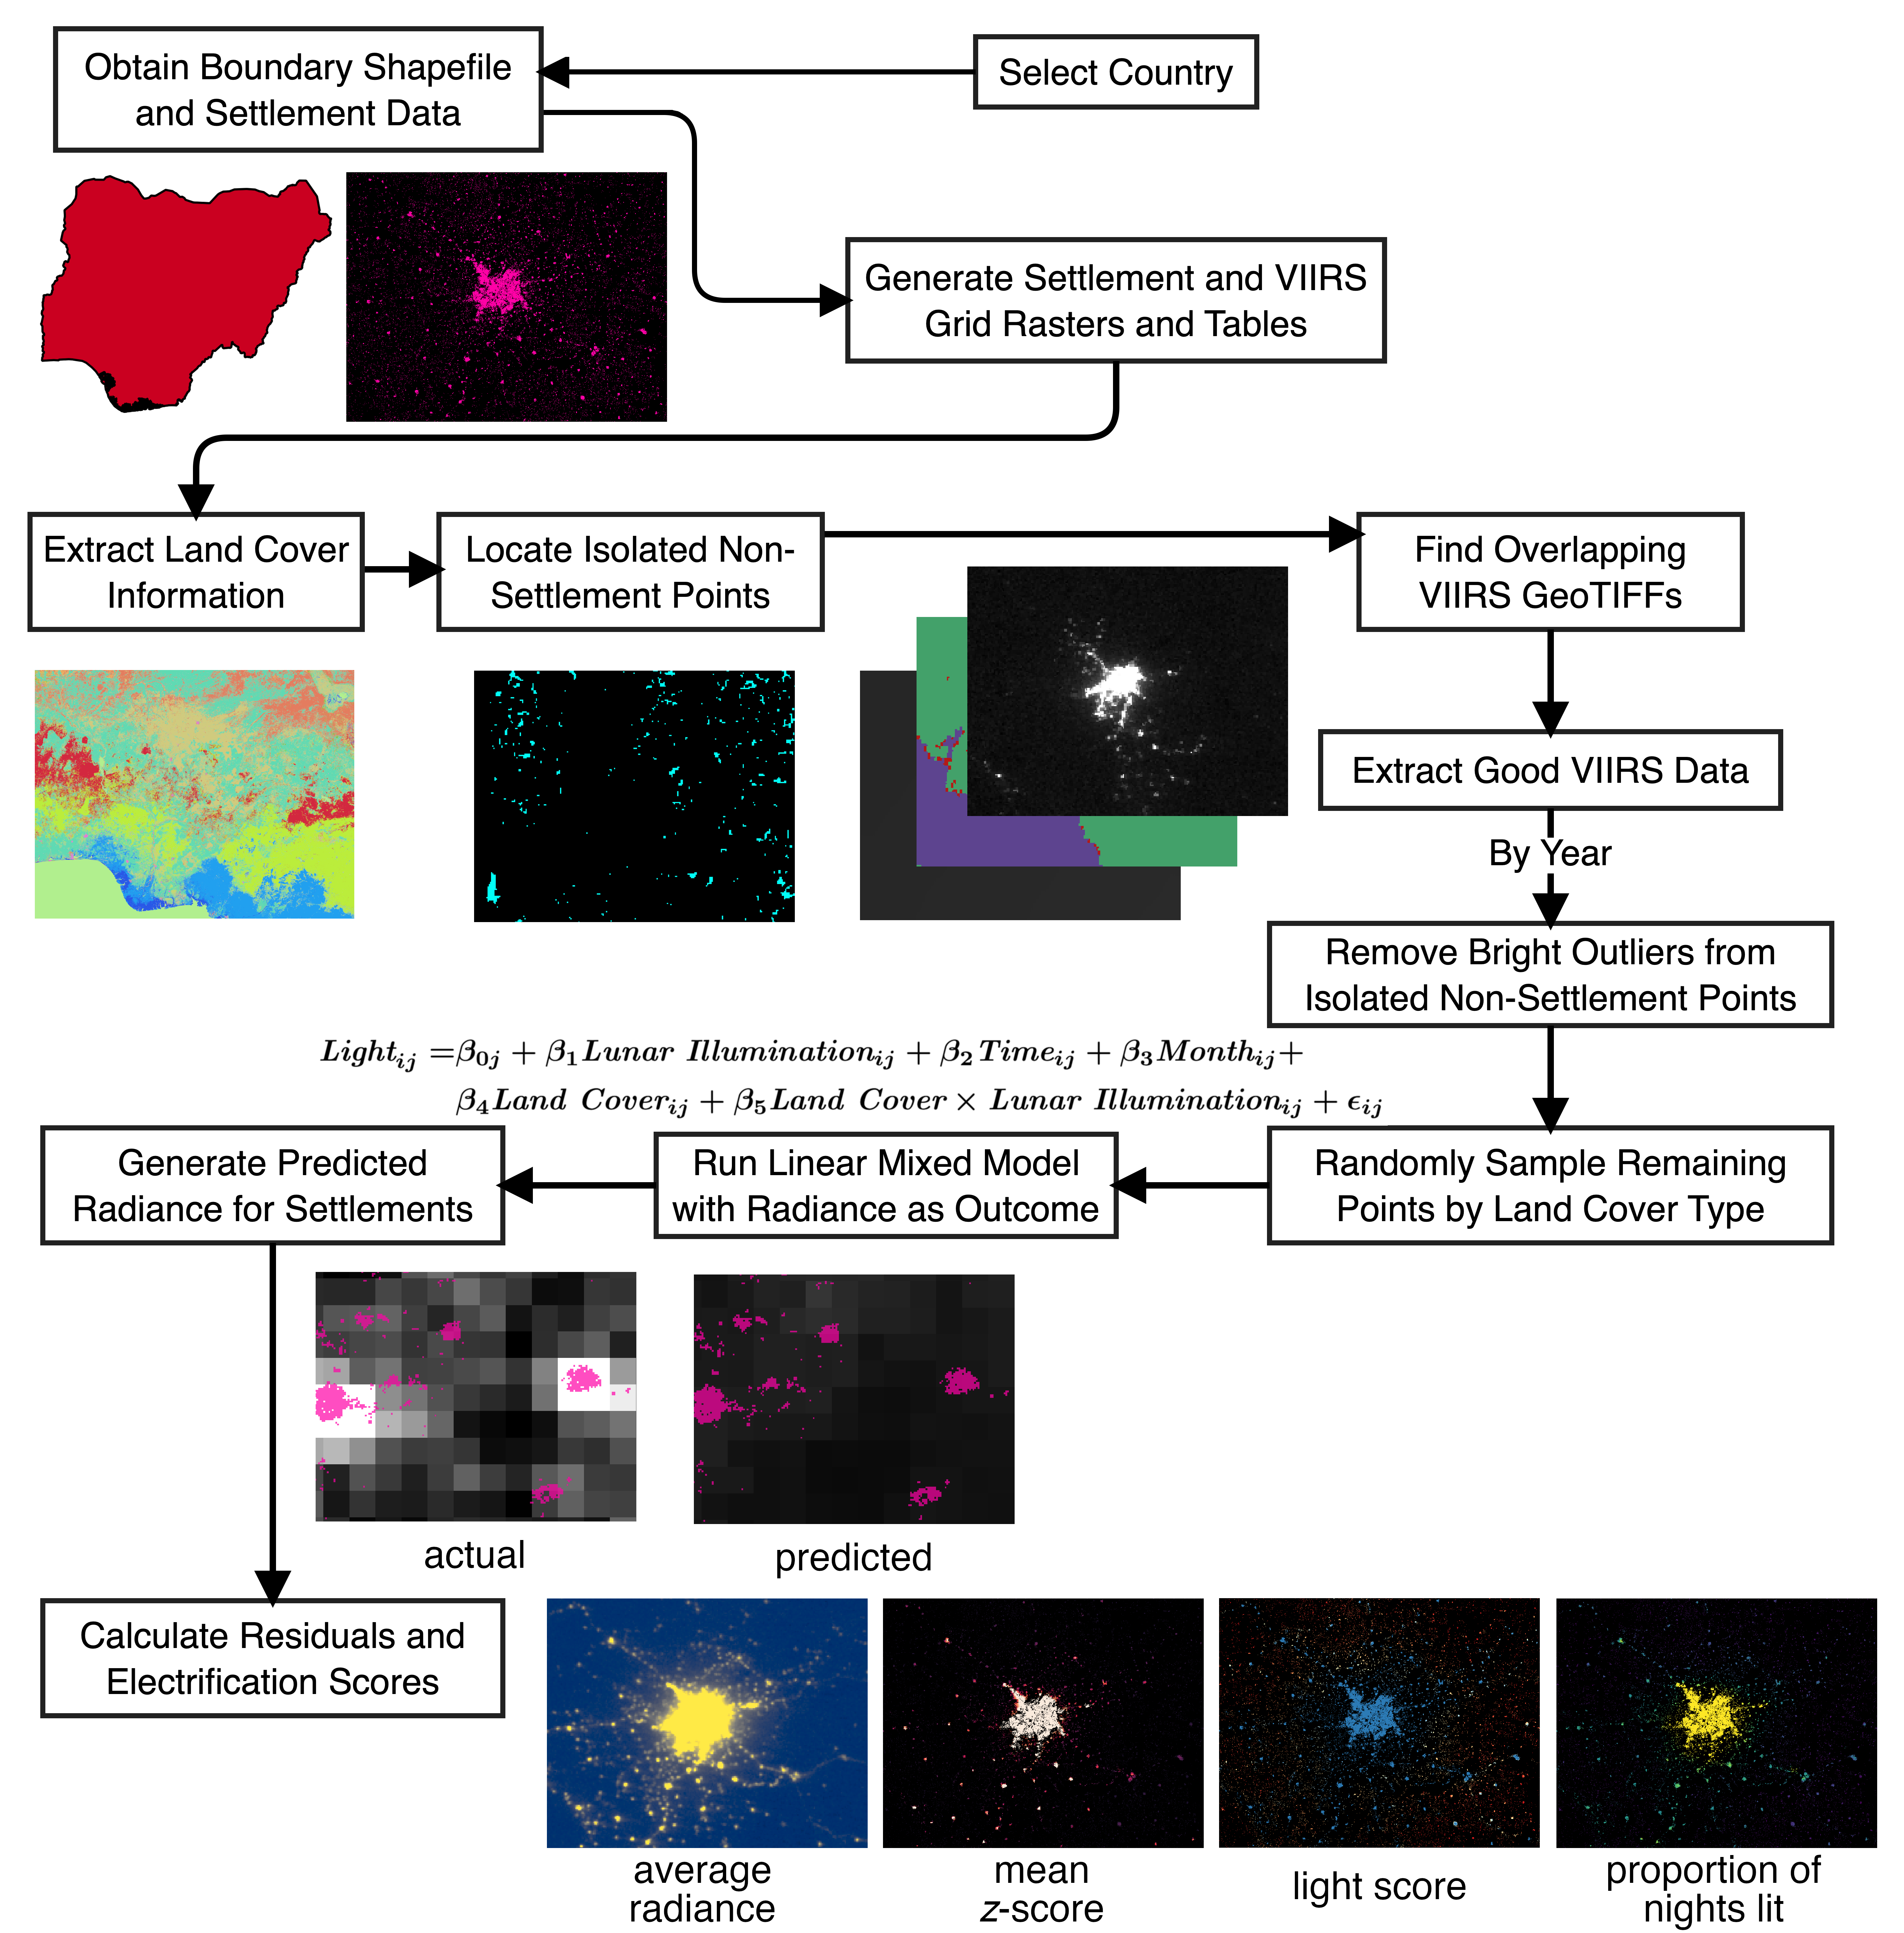
HREA Methods Flowchart
The flowchart below visually depicts the HREA process for a single country, using Nigeria as an example.
References and Resources
- Noam Levin, Christopher C.M. Kyba, Qingling Zhang, Alejandro Sánchez de Miguel, Miguel O. Román, Xi Li, Boris A. Portnov, Andrew L. Molthan, Andreas Jechow, Steven D. Miller, Zhuosen Wang, Ranjay M. Shrestha, Christopher D. Elvidge, “Remote sensing of night lights: A review and an outlook for the future,” Remote Sensing of Environment (2020), https://doi.org/10.1016/j.rse.2019.111443.
- Christopher D. Elvidge, Kimberly Baugh, Mikhail Zhizhin, Feng Chi Hsu, Tilottama Ghosh, “VIIRS night-time lights,” International Journal of Remote Sensing (2017), https://doi.org/10.1080/01431161.2017.1342050.
- Brian Min, Zachary O'Keeffe, Fan Zhang, “Whose power gets cut? Using high-frequency satellite images to measure power supply irregularity,” World Bank Policy Research Working Paper No. WPS 8131 (2017), http://documents.worldbank.org/curated/en/125911498758273922/Whose-power-gets-cut-using-high-frequency-satellite-images-to-measure-power-supply-irregularity.
- Brian Min, Kwawu Mensan Gaba, “Tracking Electrification in Vietnam Using Nighttime Lights,” Remote Sensing (2014), https://doi.org/10.3390/rs6109511.
- Brian Min, Kwawu Mensan Gaba, Ousmane Fall Sarr, Alassane Agalassou, “Detection of Rural Electrification in Africa using DMSP-OLS Night Lights Imagery,” International Journal of Remote Sensing (2013), https://doi.org/10.1080/01431161.2013.833358.
- Dan M. Duriscoe, Sharolyn J. Anderson, Christian B. Luginbuhl, Kimberly E. Baugh, “A simplified model of all-sky artificial sky glow derived from VIIRS Day/Night band data,” Journal of Quantitative Spectroscopy and Radiative Transfer (2018), https://doi.org/10.1016/j.jqsrt.2018.04.028.
- Christopher C. M. Kyba, Theres Kuester, Alejandro Sánchez de Miguel, Kimberly Baugh, Andreas Jechow, Franz Hölker, Jonathan Bennie, Christopher D. Elvidge, Kevin J. Gaston, and Luis Guanter, “Artificially lit surface of Earth at night increasing in radiance and extent,” Science Advances (2017), https://doi.org/10.1126/sciadv.1701528.
- Eugenie Dugoua, Ryan Kennedy, Johannes Urpelainen, “Satellite data for the social sciences: measuring rural electrification with night-time lights,” International Journal of Remote Sensing (2018), https://doi.org/10.1080/01431161.2017.1420936.
- Zeal Shah, Noah Klugman, Gabriel Cadamuro, Feng-Chi Hsu, Christopher D. Elvidge, Jay Taneja, “The electricity scene from above: Exploring power grid inconsistencies using satellite data in Accra, Ghana,” Applied Energy (2022), https://doi.org/10.1016/j.apenergy.2022.119237.
- Giacomo Falchetta, Shonali Pachauri, Simon Parkinson, Edward Byers, “A high-resolution gridded dataset to assess electrification in sub-Saharan Africa,” Scientific Data (2019), https://doi.org/10. 1038/s41597-019-0122-6.
- Dimitrios Mentis, Mark Howells, Holger Rogner, Alexandros Korkovelos, Christopher Arderne, Eduardo Zepeda, Shahid Siyal, Costantinos Taliotis, Morgan Bazilian, Ad de Roo, Yann Tanvez, Alexandre Oudalov, Ernst Scholtz, “Lighting the World: the first application of an open source, spatial electrification tool (OnSSET) on Sub-Saharan Africa,” Environmental Research Letters (2017), https://doi.org/10.1088/1748- 9326/aa7b29.
- Steven D. Miller, William Straka III, Stephen P. Mills, Christopher D. Elvidge, Thomas F. Lee, Jeremy Solbrig, Andi Walther, Andrew K. Heidinger, Stephanie C. Weiss, “Illuminating the Capabilities of the Suomi National Polar-Orbiting Partnership (NPP) Visible Infrared Imaging Radiometer Suite (VIIRS) Day/Night Band,” Remote Sensing (2013), https://doi.org/10.3390/rs5126717.
- Shihyan Lee, Kwofu Chiang, Xiaoxiong Xiong, Chengbo Sun, Samuel Anderson, “The S-NPP VIIRS Day-Night Band On-Orbit Calibration/Characterization and Current State of SDR Products,” Remote Sensing (2014), https://doi.org/10.3390/rs61212427.
- Miguel O. Román, Eleanor C. Stokes, Ranjay Shrestha, Zhuosen Wang, Lori Schultz, Edil A. Sepúlveda Carlo, Qingsong Sun, Jordan Bell, Andrew Molthan, Virginia Kalb, Chuanyi Ji, Karen C. Seto, Shanna N. McClain, Markus Enenkel, “Satellite-based assessment of electricity restoration efforts in Puerto Rico after Hurricane Maria,” PLOS ONE (2019), https://doi.org/10.1371/journal.pone.0218883.
Additional Information
For more information on the HREA method, please read our paper: Brian Min, Zachary P. O'Keeffe, Babatunde Abidoye, Kwawu Mensan Gaba, Trevor Monroe, Benjamin P. Stewart, Kim Baugh, Bruno Sánchez-Andrade Nuño, “Lost in the Dark: A Survey of Energy Poverty from Space,” Joule (2024), https://doi.org/10.1016/j.joule.2024.05.001
For additional details, please consult the accompanying supplemental information.
For code to reproduce HREA, please see our project GitHub repository.